Project information
- Project Name: Garments Workers Productivity
- Category: Excel
- Project URL: https://1drv.ms/x/s!AuPdiUW3jaWgcL9TeavZg1-x31Q?e=hRBVqQ
About Project
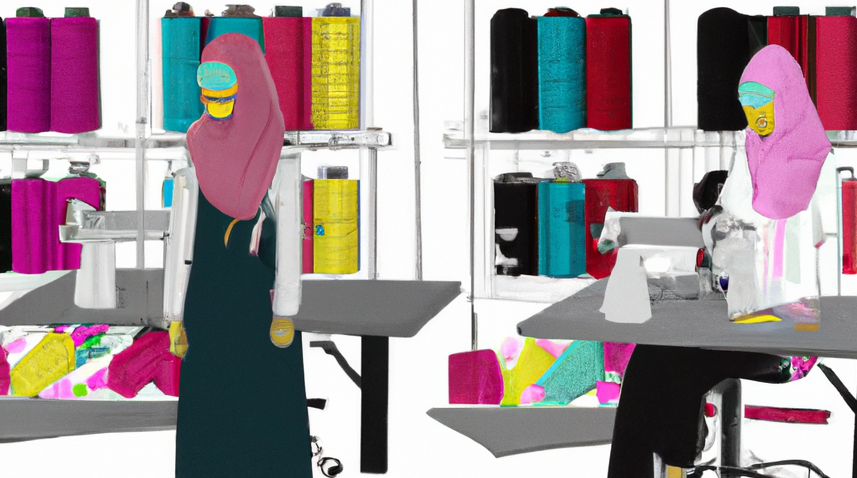
A garments workers productivity dashboard using Excel would be a tool for monitoring and analyzing the productivity of workers in the garment industry. The dashboard would provide a visual representation of key productivity metrics, allowing managers and supervisors to quickly identify trends and issues that need to be addressed.
Observations
Project information
- Project Name: Income Survey
- Category: Excel
- Project URL: https://1drv.ms/x/s!AuPdiUW3jaWgeMOH7pG9Kg1mLQc?e=3treep
About Project
An income survey dashboard using Excel would be a tool for analyzing and visualizing data collected from income surveys. The dashboard would provide a visual representation of key income metrics. The dashboard could be designed to allow users to filter data by different demographic variables, such as age, gender, race, or education level.


